Microsoft представила Flint-interactive: язык для создания интерактивных визуализаций данных с помощью ИИ
Microsoft Research разработала язык Flint-interactive, который позволяет ИИ-агентам генерировать сложные интерактивные графики и дашборды, разделяя логику взаимодействия и визуализации.

Суть
Microsoft Research представила Flint-interactive — специализированный язык, созданный поверх системы Flint. Его главная задача — дать ИИ-агентам возможность генерировать не просто статические картинки, а полноценные интерактивные визуализации данных. С помощью этого инструмента пользователи могут напрямую взаимодействовать с графиками: кликать, фильтровать, масштабировать, выделять информацию и использовать перекрестные ссылки между различными визуальными элементами.
Контекст
Современные ИИ-агенты хорошо справляются с анализом данных и генерацией базовых отчетов, помогая пользователям изучать закономерности быстрее, чем при чтении объемных текстов. Однако при необходимости глубокого исследования данных статических графиков становится недостаточно.
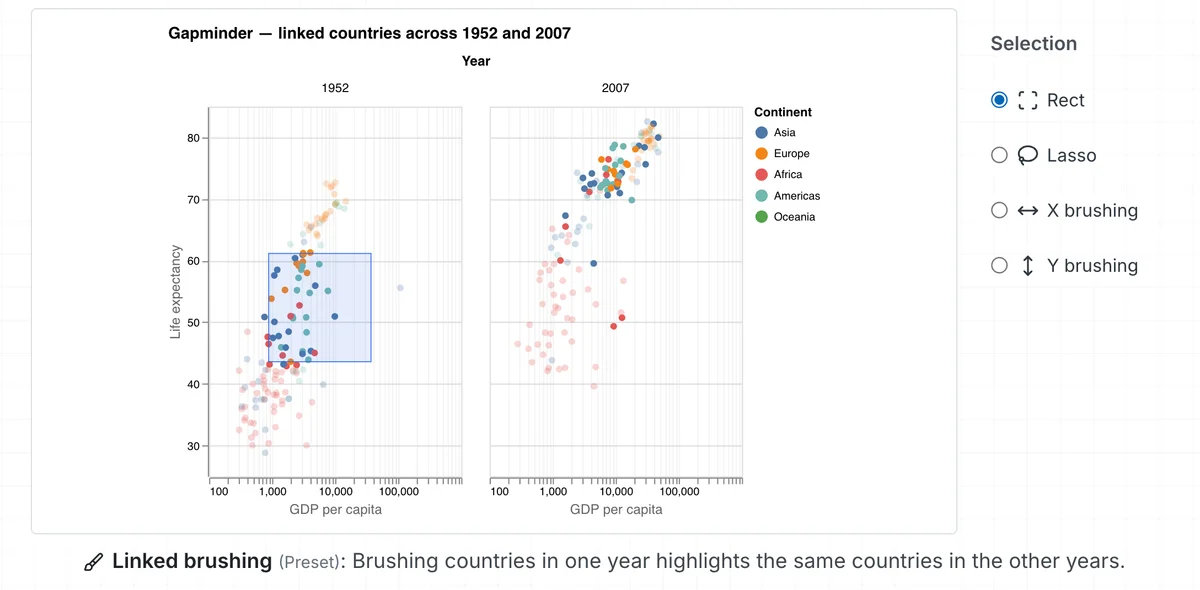
Interactive Gapminder visualization showing linked brushing across two scatterplots of countries in 1952 and 2007. Each plot charts GDP per capita on the horizontal axis and life expectancy on the vertical axis, with countries colored by continent. A blue rectangular selection highlights a group of countries in the 1952 chart, and the same countries are simultaneously highlighted in the 2007 chart, demonstrating linked selection across years. A control panel on the right provides interaction options including rectangular selection, lasso selection, and x- or y-axis brushing. The figure illustrates how selecting data points in one view highlights corresponding points in another view for comparative analysis over time.
Создание интерактивных визуализаций с помощью ИИ сопряжено с серьезными практическими трудностями. Во-первых, это высокая стоимость генерации: агентам редко удается создать полностью удовлетворительный интерактивный график за один подход. Повторяющиеся циклы рассуждений, написания кода и отладки расходуют токены и время. Во-вторых, страдает надежность: выразительные интерактивные графики часто приводят к проблемам с версткой или сломанным механикам взаимодействия, а попытки их исправить создают новые ошибки. Существующие библиотеки визуализации не обладают достаточной выразительностью для создания нестандартных графиков ИИ-агентами.
Детали
Flint-interactive решает эту проблему за счет компилятора Flint, который берет на себя управление сложными зависимостями между взаимодействием и визуальной логикой. Архитектура системы построена на четком разделении:
- Визуальная логика: Управляется компилятором. Он автоматически переводит базовые триггеры (клики, перетаскивания, нажатия клавиш) в семантические события, идентифицируя элементы графика и данные. Компилятор также берет на себя низкоуровневые задачи рендеринга и определение попадания курсора (hit testing).
- Логика взаимодействия: Задается пользователем или ИИ-агентом на семантическом уровне. Они связывают семантические события с операторами обновления графика (например, изменить стиль, добавить аннотацию, изменить масштаб порта просмотра) без необходимости манипулировать специфичными для рендерера метками.
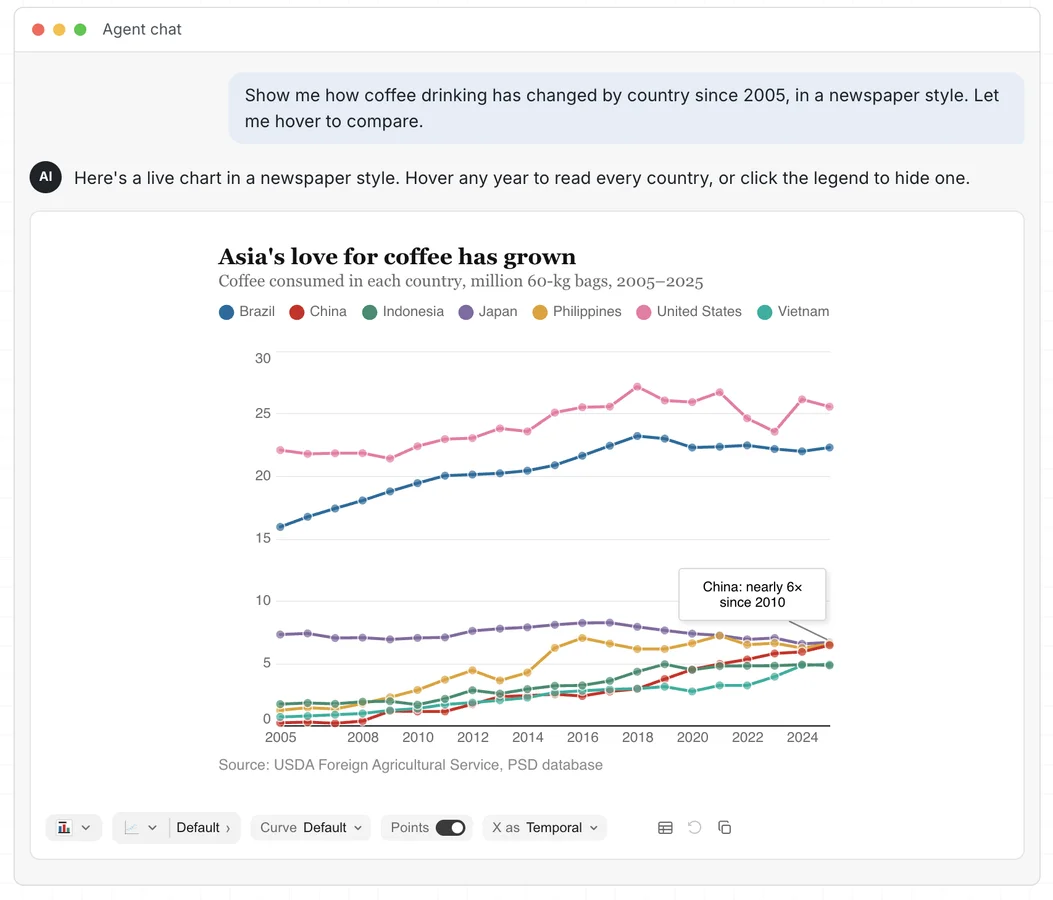
graphical user interface, chart
Систему можно использовать несколькими способами:
- В чате через Flint-MCP и приложения MCP, где агент генерирует спецификацию взаимодействия вместе со спецификацией графика.
- Для создания интерактивных приложений и дашбордов с помощью Flint Interactive Canvas, где обработчики событий могут обновлять таблицы, другие графики или состояние приложения.
- Для создания нестандартных взаимодействий через программный API, определяя собственные функции-обработчики.
Анализ
Перенос тяжелой работы по разрешению визуальных зависимостей на специализированный компилятор кардинально меняет подход к генерации интерфейсов. ИИ-агенту больше не нужно писать низкоуровневый код для отрисовки графики или обработки координат курсора. Оперируя высокоуровневыми семантическими спецификациями, модели могут создавать надежные дашборды и связанные представления данных с меньшими затратами ресурсов и времени. Это устраняет разрыв между способностями передовых моделей и реальными потребностями пользователей в исследовании данных.
Перспектива
Подход, примененный в Flint-interactive, демонстрирует эффективный путь развития ИИ-инструментария. Вместо того чтобы заставлять языковые модели напрямую писать сложный фронтенд-код, разработчики создают промежуточные семантические слои. Это может привести к появлению нового поколения аналитических систем, где пользователи смогут исследовать данные в режиме диалога, мгновенно получая сложные, кликабельные и связанные между собой визуальные истории и дашборды на уровне качественной журналистики данных.
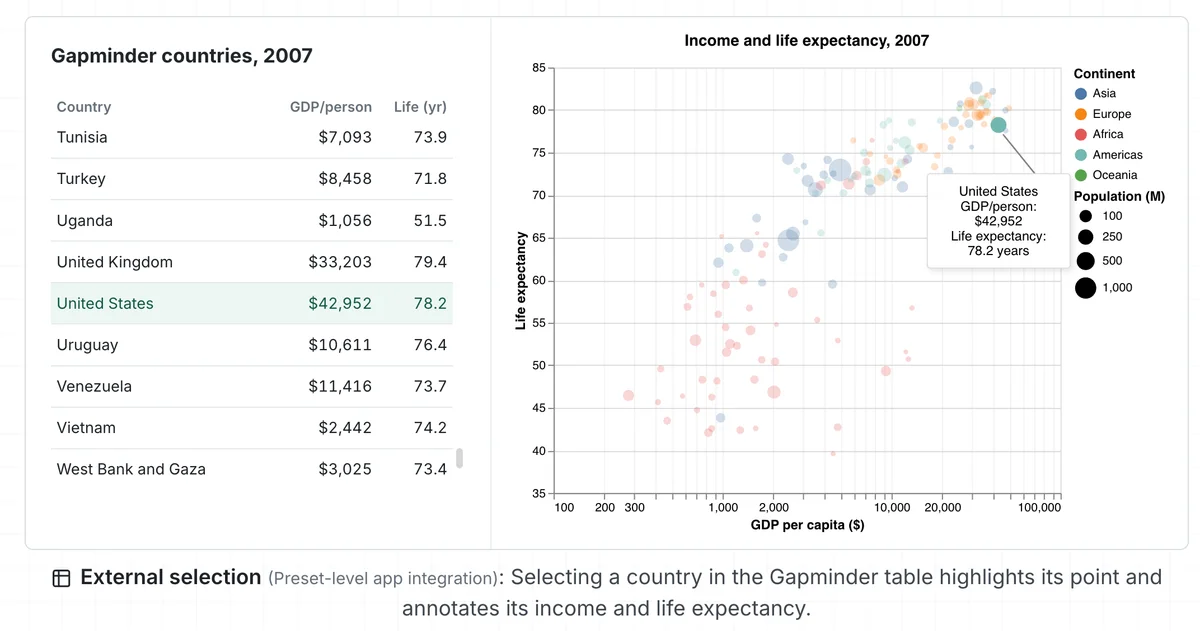
Interactive Gapminder dashboard for 2007 showing a table of countries alongside a bubble chart comparing GDP per capita and life expectancy. In the table, the row for the United States is selected and highlighted, displaying GDP per person of $42,952 and life expectancy of 78.2 years. The corresponding bubble on the scatterplot is emphasized and labeled with a callout showing the same values. Countries are colored by continent, bubble size represents population, GDP per capita is shown on a logarithmic horizontal axis, and life expectancy is plotted on the vertical axis. The figure demonstrates external selection, where choosing a country in a table highlights and annotates the matching data point in the visualization.
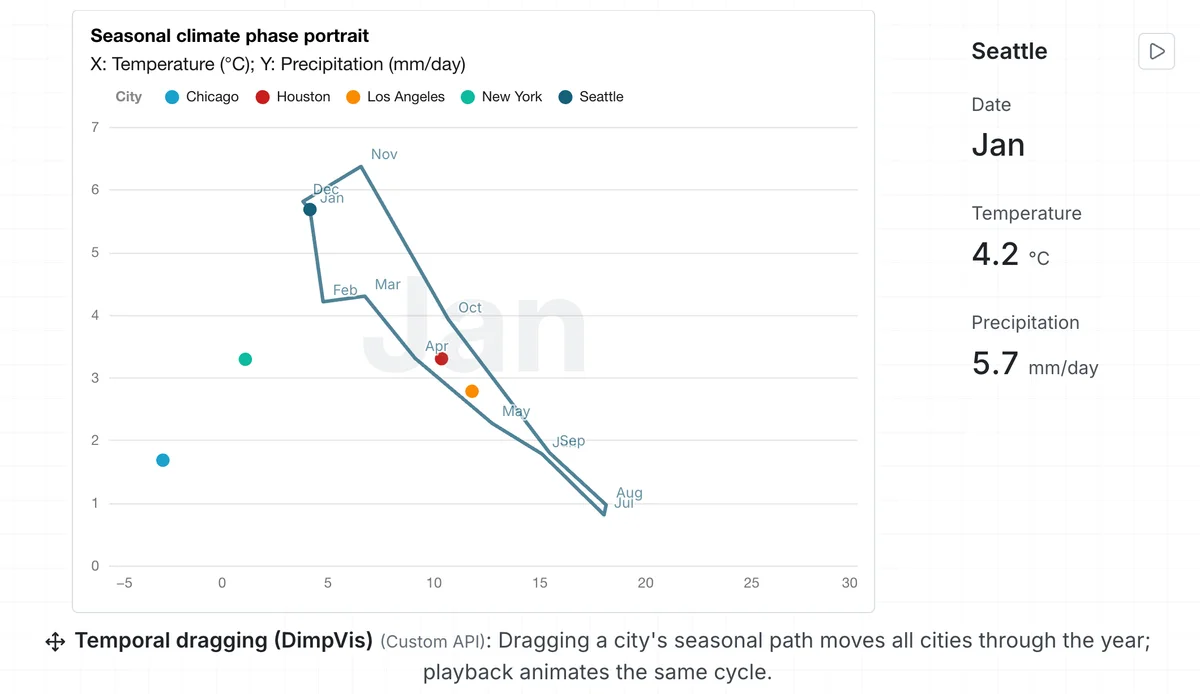
Interactive climate visualization showing a seasonal phase portrait for five U.S. cities, with temperature (°C) on the horizontal axis and precipitation (mm/day) on the vertical axis. Seattle is selected, and its annual weather cycle is displayed as a connected path labeled by month from January through December. The path shows cool, wet conditions in winter, peaking near 6 mm/day of precipitation, and warmer, drier conditions in summer, with precipitation dropping below 1 mm/day. Colored points represent Chicago, Houston, Los Angeles, New York, and Seattle. A details panel on the right displays the selected month, January, with a temperature of 4.2°C and precipitation of 5.7 mm/day. The figure demonstrates temporal dragging and animation, where moving a city’s position along its seasonal path updates all cities to the corresponding time of year.
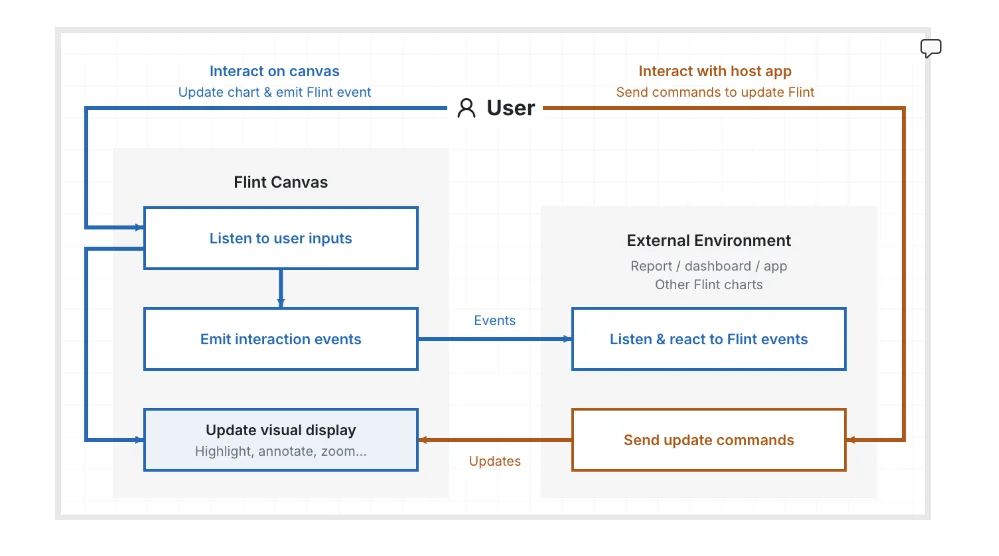
Figure: Flint interactive allows the agent to describe interaction logic by mapping “what semantic event is the user interacting with” to “what updates they want for the canvas surface”. The compiler takes the heavy lifting of resolving visual updates and manages the runtime, which makes interaction authoring more reliable and cost effective.
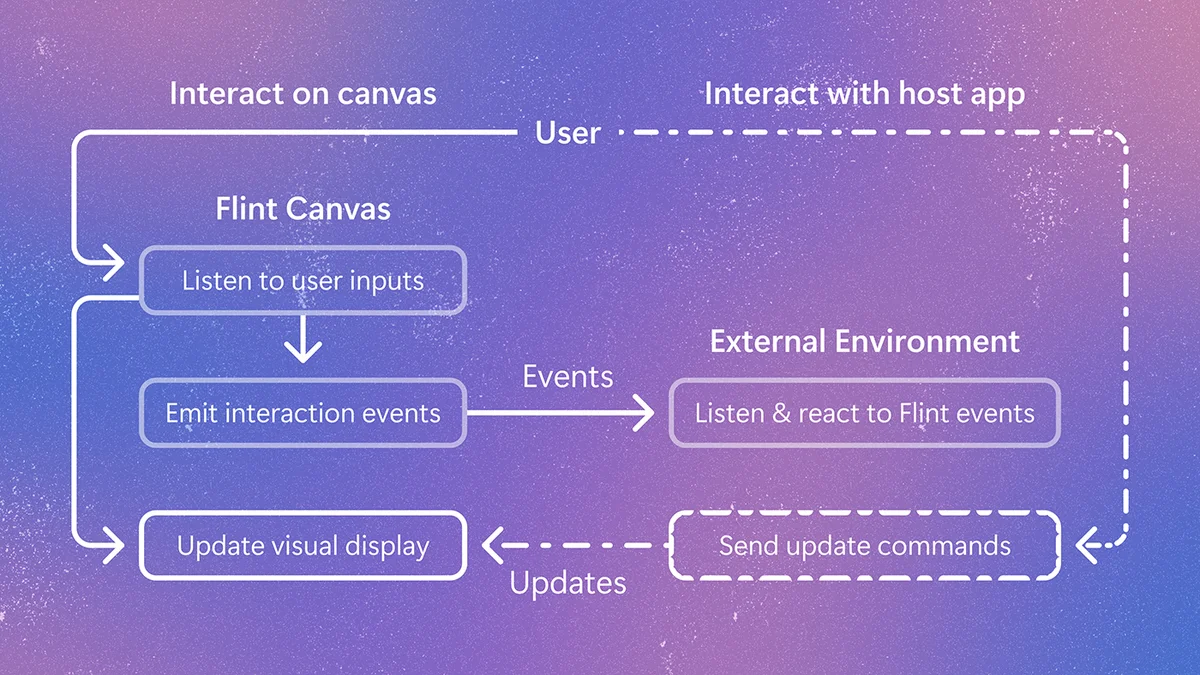
Flint Interactive flowchart | purple gradient background

Research Forum | abstract background with colorful hexagons

Portrait of Yuwei Xiao

Portrait of Alper Sarikaya
TL;DR
Главное
Microsoft выпустила язык Flint-interactive, который позволяет ИИ-агентам надежно создавать интерактивные графики, перекладывая сложную низкоуровневую логику рендеринга на встроенный компилятор.
Ключевые факты
- /Flint-interactive работает поверх системы Flint от Microsoft Research.
- /Система разделяет визуальную логику (обрабатывается компилятором) и логику взаимодействия (задается ИИ-агентом).
- /Интеграция доступна в чатах через Flint-MCP и в приложениях через Flint Interactive Canvas.
- /Язык позволяет связывать действия в одном представлении с обновлением графиков, документов или виджетов в другом.
Инсайт
Проблема некачественной генерации интерактивных интерфейсов ИИ-моделями решается не увеличением мощности самих моделей, а созданием правильного уровня абстракции — компилятора, который переводит высокоуровневые намерения агента в надежный визуальный код.